Listen: Tedi Asher '05 Bridging the Gap Between Arts and Sciences

In this lecture sponsored by Sigma Xi, Tedi Asher ’05 speaks on a neuroscience-informed approach to the design of art experiences in a museum setting.
"The overarching goal of the neuroscience initiative is really to allow neuroscience to inform many different realms of the museum's operations," explains Asher. "We hope that the result of these endeavors will be not only to create more engaging experiences of art for our visitors, but also to help bridge the gap between the arts and sciences which I see as two disciplines that address, or attempt to address, many of the same questions about the human experience just using a different set of methods and approaches.”
Asher earned a bachelor's in biology from the College and a Ph.D. from Harvard Medical School in biological and biomedical sciences. She currently works at the Peabody Essex Museum in Salem, Mass. as a neuroscience researcher.
Audio Transcript
Deborah Jin: Thank you all for coming. My name's Deborah Jin. I'm the president of Sigma Xi this year, which is a great honor. It's a wonderful organization of honoring and supporting research and science throughout the world, actually. We're fortunate to have a chapter with some resources to help support speakers and ... very happy this fall to have the opportunity to support the woman that we're all very proud of. Tedi Asher's here to speak. I am not the right person to introduce her because she's actually a former student of our colleague, Kathy Siwicki. I'll turn it over to Kathy to introduce the speaker.
Kathy Siwicki: Okay, thank you Deb. Thank you to Deb, and the Sigma Xi officers who are supporting my effusive and enthusiastic request earlier in the summer to have a Sigma Xi with Tedi Asher. When I saw ... I don't know if any of you guys have seen, there was piece on the college news website in June about Tedi's amazing new job as a neuroscience researcher at the Peabody Essex Museum in Salem. I was like, "Oh my god, that's such a perfect thing for a Swarthmore woman to do. To be working in an art museum setting after getting her training as a scientist both here and graduate school."
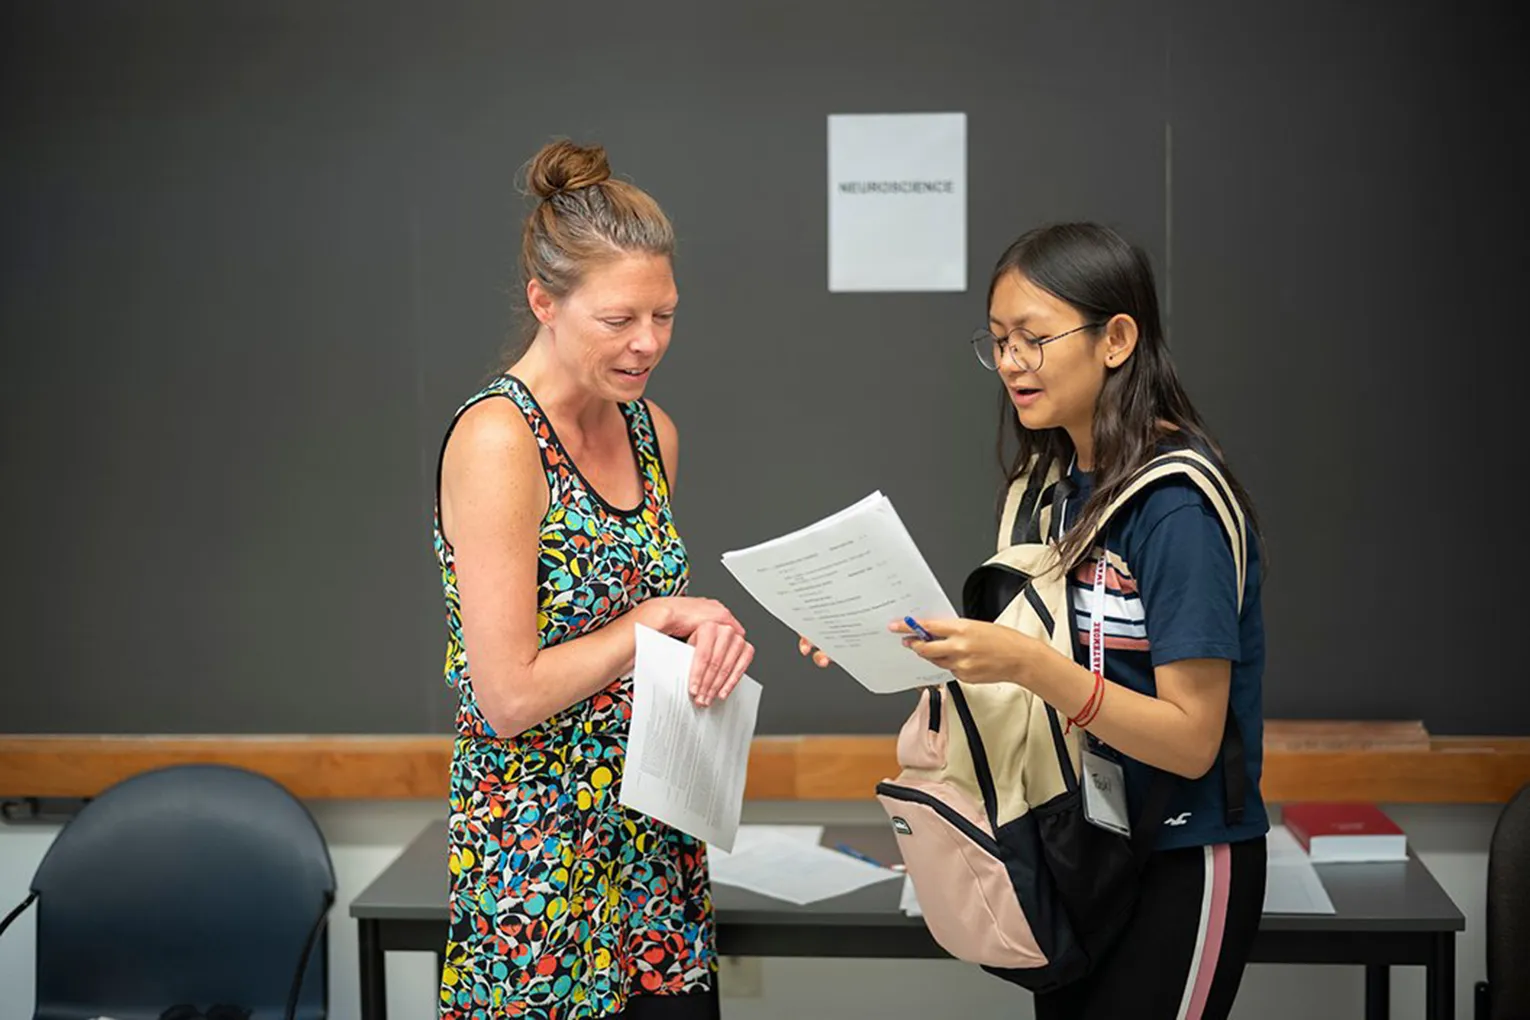
Tedi was ... oh right. And so here's Tedi Asher, the neuroscience researcher at Peabody Essex Museum, but this is Tedi Asher as a budding neuroscientist, a budding neurobiologist, as a sophomore in neurobiology lab. She and her lab partner, Kasha, are there proudly displaying their sheep brains in your biology lab as sophomores.
This isn't the first course that Tedi had with me. She subsequently took my seminar course the next semester. She did her thesis research in my lab. Her thesis research was on fruit flies, you know fruit flies sexual behavior. She was watching fruit fly males pursuing fruit fly females and trying to figure out what they learned when they were repeatedly rejected by the females.
After leaving Swarthmore ... so in the context of her research, Tedi was always incredibly diligent and independent in the way she thought about things. Very rigorous in her analysis of the data and in her kind of brutally honest with herself and with me about this data isn't really showing what we thought it was gonna show, right? She wasn't kidding herself or me about any of her data. She was totally honest, and I got some interesting results for sure.
Okay, so then she was also a really good collaborator. She worked so well with other members of the lab. And at first, when she started in the lab as a sophomore I think, was kind of shy and let other people boss her around and tell her what to do, but very quickly stepped into a leadership role in the lab so that she shared her expertise really generously with younger students in the lab and was just a great role model.
Then she left here, she went to the National Institutes of Health in Bethesda, had one of those IRTA Postbac positions working at a vaccine research center at the NIH I think for four years, where they were working on designing and developing HIV vaccines.
Eventually, found a way up to Harvard, where she joins a PhD program in biological biomedical sciences at Harvard Medical School. There she studied aggressive behavior in mice. So it's kind of like fruit flies sexual behavior. Instead of male/female, it's male/male, but anyway, trying to look at the brain mechanisms that regulate and modulate aggressive behavior in mice. If you're interested in learning more about that, you can come back tomorrow at 2:00 when Tedi's gonna be talking about that, her thesis research.
Finishing a Harvard PhD, wow what a slog. It's never easy, graduate school. Tedi decided to make a very courageous move. In fact, a kind of unprecedented move for a newly minted neuroscience PhD, to move into a position as a neuroscience researcher. A whole new kind of position [inaudible 00:04:36] I guess I'm not surprised to see her taking a [inaudible 00:04:41] like that.
Knowing her as I knew her, I went back and looked at some of the things that I had written about her and the letters of recommendation that I wrote for her bachelor applications. High level of intelligence, which I can say about just about every Swarthmore student. And independence, can't say that about everybody, but it's true in Tedi. High standards of personal responsibility and intellectual honesty, as I just said. And the thing that really struck me from that letter is that the point that I made over 10, 12 years ago that Tedi constantly strives to integrate information from different sources. I think that's exactly what she's doing now in this work that she's doing here at the Peabody Essex.
So I'm just really excited to hear what she has to say about this new world of neuroscience researcher at a museum.
Tedi Asher: All right. Can everyone hear me? Okay. Thank you for that really kind introduction, Kathy. It was really wonderful. It's amazing to be back on campus and to see everyone. It's really kind of overwhelming, actually. In fact, I'm really pleased and rather grateful that you're all here to listen to ... talk about some of the work with which I've been engaged over the last couple of years.
In short, I hope you'll understand all of this in more detail at the end of this talk. But in short, my role at the Peabody Essex Museum or PEM, as we usually call it, is to inform exhibition design with findings from neuroscience research. So we call it neuroscience research, but it's really like anything that's applicable is what I've found. When I arrived at PEM a year and a half ago, we knew what our goal was, but we had no idea how to get there.
It's been an evolving process. Lots of trial and error. Just as an example, as a trained scientist one of the things that I had to really grapple with is the fact that we're performing studies in the museum. A museum is by no means a controlled setting, right? You really have to think about the studies differently than you would in a lab, I think. By the same token, I'm also coming to terms that it may not be possible to really fully understand the human experience of art in a laboratory setting and I'll show you some data to that effect.
It's been an evolving process both personally and professionally. What I'd like to do today is to tell you a little bit about where we've been and where we are now and where we're going and really to get some feedback because we're just taking in everything we can at this point.
Specifically, I'll first introduce you to the Peabody Essex Museum. It's kind of a special place, like Swarthmore. I'll tell you about our neuroscience initiative and it's goals which really center around enhancing engagement which is a term that's used a lot, I'm finding, in the museum field, but is rarely defined or at least well defined. So we'll look at one definition for engagement and then we'll look at the ways that we're trying to measure engagement in a series of in gallery studies.
I'll tell you about our first study which has a lot of caveats, but it's kind of exciting.
This is the front of the Peabody Essex Museum. It's a museum of art, culture and creative expression located in Salem, Massachusetts. Our collection really spans a wide range of different types of art ranging from American art to Asian export art to Maritime art history where the roots of the museum really began. Over the past couple decades, PEM has really matured and grown a great deal. We now stand among the top 20 North American art museums in terms of our endowment, operating budget, and size of facilities. So we really have a great deal of resources to devote to our mission which is to create experiences that transform people's lives. Specifically, by attempting to broaden their perspectives, attitudes and knowledge of themselves in the wider world.
In my, albeit limited, experience this is a rather unique mission to have. From my understanding, many museums have a mission of increasing attendance or getting more people to see the objects that they have on view. But at PEM, really in our day to day operations, you hear the word transformation all the time. No one defines it though. But we really ... this is what we're striving for.
I thought I would just give you a couple of examples from past exhibitions to show you how this inspiration manifests in how we design exhibitions. This is a picture of the entry experience to an exhibition that we put on a few years ago before I arrived called Asia and Amsterdam which really told the story of Asian export art. The entry experience to this exhibition, which was largely a visual exhibition, right? Looking at various artifacts and works of art emanating from Asia for use in the west. The entry experience was an old factory one. So these are jars of ... oops. What did I do? Oh good, wonderful. Okay, I'll be careful.
These are jars filled with spices that are derived from geographic regions that are featured in the exhibition. So, trying to draw on multisensory or create a multisensory experience. In another exhibition on Rodin sculpture, we brought in dancers so that our visitors could see in movement the structures that Rodin had sculpted.
I show you these examples all to say that PEM really sees itself as creating experiences of art. It's here that we come upon the origins of the neuroscience initiative at PEM. Our director and CEO, Dan Monroe, reasoned that all experiences in one way or another are generated by the brain, by neuro function. So that perhaps understanding more about how the brain works, particularly in the context of art and in the context of a museum, perhaps we can create more compelling experiences of art in a museum setting.
The overarching goal of the neuroscience initiative is really to allow neuroscience to inform many different realms of the museum's operations. I've listed just a few of them here. Where we started is really with exhibition design and interpretation. Does everyone know what interpretation is because I definitely didn't. No? Okay. So interpretation ... exhibition design has to do with how you spatially arrange the objects and direct people through the exhibition. Interpretation are the features of the exhibition that help the visitor to understand what they're looking at. So, a label, an annotated label, might be a piece of interpretation or a video showing an interview with the artist. That would be another piece of interpretation.
So this was our goal and we started here. And specifically, within that context, the goal, as I mentioned, was to allow findings from the fields of neuroscience to inform exhibition design. But it's also my hope that by studying our visitors responses to the exhibitions that we create using certain methods that I'll tell you about a little later, we might be able to understand something more about the brain and contribute to neuroscience itself.
We hope that the result of these endeavors will be not only to create more engaging experiences of art for our visitors, but also to help bridge the gap between the arts and sciences which I see as two disciplines that address, or attempt to address, many of the same questions about the human experience just using a different set of methods and approaches.
So how might we go about employing neuroscience to optimize museum experiences? The approach that we've taken is kind of bifurcated. On the one hand, we want to leverage existing data out of the literature and see how we can apply it to exhibition design. But on the other hand, for reasons that we'll get to in a little bit, we also felt the need to generate our own data about our own visitors in our own museum. So these are the two approaches that I'll be telling you about.
Specifically, the approach that we've taken to implementing that strategy is more or less a scientific approach. So I think of it as coming in three phases. There's what I think of as the research and hypothesis formulation base which is a mouthful to say in these talks, in which we dive into the literature and try to identify findings that could be relevant to exhibition design. And then through various forums, including a lecture series that they called teddy talks, against my strong objection, we together formulate hypotheses about how to apply those findings in a particular exhibition.
So then we move to an implementation phase where we execute on that hypothesis that we formulated in phase one and use a range of interpretation and design elements within the context of the specific exhibition to sort of test that hypothesis.
Finally, we have an evaluation phase where we use a mixed methods approach, which I'll tell you about in a moment, to evaluate the impact of these design decisions on the visitor experience. I think we've just started to run our first set of studies and I think what's going to be really important for us is to use that data and the lessons learned from those studies to go back and refine our initial hypotheses. I see this process as being inherently narrative.
This is the process or the strategy that we use to address a really wide range of different topics. One thing that we're very interested in is how visual attention is allocated in museum setting. How do you decide where to look, what to give your attention, because invariably there's far too much to see. We're interested in the role that emotional experiences play in facilitating engagement and we're interested in the ways that environmental cues, and context more generally, can impact us on a behavioral level, an effective level and even a physiological level.
So before we delve into any of those questions, I just want to take a minute to define what I mean by neuroscience because I think it means many different things to many different people. As you're all probably aware, neuroscience can address processes ongoing in the individual cells or neurons. It can look at circuit dynamics or the way that neurons communicate with one another. It can study the brain as an organ system and look at regions that are activated or suppressed, like you do with SMI imaging. We can even study behavior as a manifestation of neuro function. The point that I want to make is that ... that keeps happening.
The point that I want to make is that we try not to restrict ourselves to any one of these levels of investigation, but rather to integrate findings across them in order to gain as wholistic an understanding of the phenomenon that we're trying to study as possible.
We do this all with the hope of enhancing visitor engagement. As I mentioned, this is a really ill defined term. But luckily, we have a neuroscience advisory committee on which sits a neuro marketer named Carl Marci. He's actually an MD Psychiatrist, but his day job is as a neuro marketer. Anyway, Carl has this definition for engagement or kind of an equation for engagement that he's derived over decades of conducting these neuro marketing studies. So what Carl posits is that one is engaged when attention is directed or captured in a way that elicits emotion and leads to the formation of a memory. For completions sake I'll add that Carl has a fourth element of changing behavior, but we're not as interested in that so I leave it. I cut it off at memory.
All right. So what I'd like to do next is just to take kind of a whirlwind tour through what neuroscience, broadly defined, can teach us about each of these three elements. And what I'll share with you is by no means comprehensive. It's just kind of a very superficial look at what we can learn. It represents some of the concepts that we're thinking about and trying to understand.
We'll start with the element of attention. As it turns out, attention is the key differentiating feature between two modes of information processing described by [inaudible 00:16:36] referred to system one and system two. So while system one operates very quickly, it's unconscious, it doesn't require a great deal of effort, it can be rather error prone and importantly it does not require attention. This is the mode in which we spend the majority of our time. By contrast, system two is sort of much more deliberate. It works more slowly. It is conscious. It takes a great deal of effort and it requires attention.
So one of the ways we think about what our goals are at PEM is really how we can elicit the attention that's required for system two processing at key points during exhibitions in our galleries. So I like to think of the factors that influence attention as falling into one of two categories. You have top down influences on attention and bottom up influences on attention. Bottom up influences are going to be physical in nature. They're things like sights, sounds and smells. Anything that really stimulates your sensory pathways. By contrast, top down influences on attention are cognitive in nature. These might be things like the goal with which you perform a particular action or the memories or associations that are elicited by particular stimulus.
I thought I'd just give you an example using a Where's Waldo puzzle. You guys all know these, right? Okay. I'm getting old so I don't know what's current. Okay, so in this puzzle we can imagine that our attention might be drawn to this big red and yellow tent because of it's size and bright color combination. And those would be bottom up influences on our attention. But we know that we're looking for Waldo, who is always wearing a red and white striped outfit, and so our attention may in fact be drawn to other red and white elements within the image. That would be a top down influence on attention. Did anyone find Waldo?
This was the topic of one of my first teddy talks at PEM because I think it might be useful to us to think about ... although these two categories of influences work together, I think it can be useful to think about what category we're turning to to try and direct or guide attention in galleries. And this is in part because these two different categories have different dynamics. So, top down influences will be slower to redirect attention than bottom up influences and they'll also be more idiosyncratic, right? Your memory of Swarthmore is not my memory of Swarthmore, but we all basically see it in the same way with the same mechanisms. So bottom up influences will be more universal.
What I think the literature supports is the assumption that whatever strategy we use to guide attention, it must elicit emotion. There's a lot of data to suggest that emotional experiences are in a way privileged. It's known that they attract more attention, they're processed faster and they're remembered better. So we really wanted to dig a little deeper and try and understand how you can break emotion down into measurable quantities.
You can break emotion down into these two dimensions of arousal plotted here on the Y axis and valence plotted on the X axis. So arousal is really the emotional intensity of an experience. While valence is how pleasant that experience is. Does it induce approach or avoidance behavior? So on this graph, something that's very pleasant would be over here, something that's unpleasant would be over here.
As you can see, you can map these different emotional states on to these different points on these axes. So, for example, if someone is calm, they're going to be low on the arousal scale but high on the valence scale. Whereas if someone is tense, they'll be high on the arousal scale and low on the valence scale. What's interesting is that it turns out that it's the level of arousal that correlates with the probability of forming a memory. So the more emotionally intense an experience is, the more likely we are to remember it.
So that's my whirlwind tour of these elements of engagement. So much of the data that I just talked about was derived in a laboratory setting. If this is our equation for engagement, we really want to have a way to measure each of these elements, right? But we want to be able to do that in the museum context. In part, because there are a number of papers suggesting that we demonstrate different kinds of aesthetic responses in different contexts. For example, in this study participants were shown a series of images either in a laboratory setting or in a museum setting and they were asked to rate their experience of those images on these five different scales. What you can see is that the light gray bars represent the ratings for viewing images in a lab setting while the dark gray bars represent the ratings for the images viewed in a museum.
What I hope you can appreciate is that the dark gray bars are taller than the light gray bars, right? So the people are perceiving themselves, for lack of a better word, being more engaged according to these various dimensions in a museum setting. We set out to try and evaluate visitor engagement using a mixed methods approach in a museum setting.
To do this we borrowed from Carl's toolbox, our neuro marketer advisor. We are monitoring attention allocation using gaze tracking glasses which is sort of like eye tracking glasses, but you can't see where the fixations are being made so you get a field view of what the person's looking at. We use biometric measurements to get a sense of emotional arousal. And in particular, we're using the galvanic skin response which I'll tell you about more later. And then we administer exit surveys or conduct exit interviews to try, amongst other things, to get a sense of what types of memories visitors are starting to form from their experience at PEM.
This is one of my colleagues, early on while we were testing the equipment, all wired up. You can see she's wearing these glasses which are wired to a computer that's in this backpack and here she has her galvanic skin response monitor on and she's in this exhibition that I'll also tell you about more in a moment.
So my approach to these studies is that each one really has a specific hypothesis that's being tested, but we can also ... it generates tons of data. So my goal is to track certain variables over the course of multiple exhibitions as a way of controlling for object driven effects.
For example, how long do people spend at different points in an exhibition across different exhibitions? And you'll see why that's relevant in a little bit.
I just wanted to give you a sense of what the raw data looked like. Here you have a screen shot from the video footage that's captured by the gaze tracking glasses. This is footage from an exhibition, which you'll see more in a minute, featuring a Native American artist who was a painter, a song writer and a poet and so we happen to have his guitar on display so the person is interrogating his guitar visually. At the bottom we have the galvanic skin response over the course of the exhibition and this red line indicates where in this trace we are at the time that the person is looking at what's shown in the footage. So you can correlate the level of emotional arousal as measured by galvanic skin response with what the person is attending to visually.
For our first study, we decided to focus on one factor that can influence attention. Namely, the viewing hole or the purpose with which one looks at a work of art. So, dating back to about the 1960's when Alfred Yarbus was conducting his studies, it's been shown that the goal with which you look at an image greatly impacts your viewing behavior and therefore has the potential to greatly impact the nature of your perception. So, Yarbus' study had one participant, but don't worry, it's been replicated many times. What he did was to show this image, this painting, to his participant along with a series of prompts. So he started out by letting the participant view the painting without an explicitly stated purpose. So the participant was free viewing, and this is what the eye tracking data looked like. But when the participant was asked to give the ages of the people depicted in the image, you can see the eye tracking patterns change and now the fixations cluster around the faces of the individuals in the image which is useful if you're trying to assess age.
So, on it goes. As the questions changed, so did the eye tracking data. There's been about fifty years of research following up on this finding and there are now, as far as I can tell, basically standardized viewing tasks that people can engage in to study this phenomenon. The point I want to make here is that each of these viewing tasks or viewing goals is associated with a characteristic set of viewing behaviors.
As I was reviewing this literature, I began to wonder whether some of these viewing goals, because of the different viewing behaviors that they induce, might influence engagement with a work of art differently. So, do viewing goals impact engagement as mediated by viewing behavior is our question.
I just want to give you an example of one of the pieces of data that led me to think along these lines. It turns out that when we free view an image, when we look at it without an explicitly stated purpose, we demonstrate something called the central bias which is where we focus our visual attention on the center of the image. You can see that here. In this graph, the X and Y axes delineate the boundary of an image and the black dots represent where participants actually looked early during visual exploration while the white squares represent where an algorithm predicted that participants would look based on where the salient elements of the images were located.
Hopefully you can see that the white squares are distributed kind of evenly across the image whereas the black dots are clustered toward the center. This shows us evidence of the central bias and also evidence that it's not just salients that is dictating where we look.
The next question that I began to think about is whether changing the viewing task would disrupt this pattern of viewing because I ... this is not shown. I don't have data about this, but I just began to wonder if you're only focusing on a small fragment of the image, does that inherently limit your potential for engagement? So can we change the viewing task, increase the surface are that you're taking in and potentially enhance the probability of engagement?
To address that question ... There are several studies that address that question. One of which I'm showing you data from here. So in this study participants were shown a series of images, again, and the salient elements of the image were either concentrated centrally or distributed peripherally. So that's the central and peripheral here. And the participants were either led to free view the images, to look at them without a dictating goal or they were asked to search for a particular element within the images, so to perform a search task.
What they found is that on the first fixation, so the first place that people looked, tended to demonstrated the central bias. You can see that in these plots where the red cloud represents a region of high density fixation, so places where people looked often. The blue represents the opposite. So you can see that the red cloud in each of these conditions is hovering in the middle of the plot representing the central bias. However, over time, there emerged a difference between the free viewing condition and the search task condition. In the free viewing condition, you can see that later in visual exploration by the twelfth fixation, that central bias is still present. So people are still tending to look at the middle of the images. By contrast, when they were searching for something you can see the central bias begin to, or this red cloud, break up as I like to think of it by the third fixation. So people were interrogating other parts of the image later during visual exploration.
So this suggests that changing the viewing task can, in fact, change behavior and may have implications for one's level of engagement. So this is what we wanted to address in our first study.
Specifically, our hypothesis was that giving visitors any viewing goal will help them to engage with the work of art that they're looking at and more specifically that giving them what's called a judgment task, or a judgment goal, will help them to engage the best. What I mean by a judgment goal is any sort of question or prompt that causes you to relate yourself to the work of art or the image that you're looking at. So, do you like this image? Are you moved by this image? If the people depicted in these paintings could speak, what would they say to you? Anything that causes a self referential pattern of thinking.
The reason we thought this would be the best at helping people to engage has to do with the areas of the brain that are activated when people experience a moving aesthetic ... people have a moving aesthetic experience.
This is an FMRI study from a few years ago showing just that. So again, participants were shown a series of images. They were asked to rate these images on a scale from one to four according to how emotionally moving they found each image. So a rating of one would be not very emotionally moving, a rating of four would be very emotionally moving. And so while the participants viewed these images, their brains were scanned with FMRI. Some of these results are shown here. I just want you to concentrate on the right side of this figure. In each of these schematics, the front of the brain is over here, the back of the brain is over here and the yellow and orange indicate regions of activation where the blue areas indicate regions of suppressed activity.
What I hope you notice is that when participants viewed images that they had rated with a one, a two or a three, there's this blue shading in a part of the brain or a circuit in the brain called the default mode network. However, when participants are looking at images that they rated as being very emotionally moving, you can see that blue cloud in some regions has gotten smaller and in other regions, like the medial prefrontal cortex, has gone away completely. What this is saying is that when participants are looking at images that they find to be not very emotionally arousing or aesthetically moving, their default mode network is suppressed. Whereas when they're looking at something that they find to be very moving, their default mode network is relatively activated, it's derepressed.
What we know about the default mode network is that it tends to be suppressed when we're focused on external stimuli and relatively activated when we're focused internally, when we're engaging in introspection. And so what the authors posited is that default mode network activation may facilitate self referential thinking which may be a key component of having a moving aesthetic experience.
In our approach in our study, we sort of jumped in at this level and tried to engage people in self referential thinking using these judgment tasks in the hope that it would help them to have a more moving aesthetic experience.
So this is the exhibition, or the floor plan of the exhibition, in which we tested this hypothesis. So again, the exhibition is called T.C. Cannon, the artist's name, At the Edge of America. This, just by way of background, was a Native American artist as I mentioned. Poet, song writer, painter. Unfortunately, he passed away very young but we were fortunate enough to collect a great number of his works and to create this exhibition that featured all the different forms of art that he created. This is the entrance to the exhibition. The first thing you experienced was this knowledge box or cube as I'll refer to it later which was sort of a four walled structure where each of the walls had a video montage projected on to it and there was narration overlaid. So it was this very immersive experience. And then you emerged into the gallery where there was a rather directed path that you took through the works of art until the exit over here.
I just want to point out that these magenta ovals here denote media experiences and we'll be looking a little bit later at some of the effects these media experiences had on how long people spent at a designated point in the exhibition and what their level of emotional arousal was. Because we often use media experiences in our exhibitions, but we don't often know what effects they have. That was one of the questions that we wanted to ask.
Our strategy was to select nine works of art, which are presented here by the red stars, at which to study our visitors responses as a function of viewing prompt. These are the nine paintings that we selected and we divided our participants into four groups. One group did not receive any viewing prompts so they were wearing all the equipment, but we just sent them into the exhibition and said, "Do what you normally do." So they could read the labels on the wall, they could interact with the interactives, but they didn't have any extra content that we provided.
The other three groups received one of three viewing prompts. Either a free viewing prompt, a search prompt or a judgment prompt in different orders across these nine objects. So, not randomized, but kind of a counter balanced approach of distributing these prompts. Just to give you a sense of what the prompts were like, the free viewing prompt consisted of a historical fact about the painting or the artist. So, it was content that was not meant to influence your viewing behavior, but was just mean to give you historical context about what you were looking at. By contrast, the search prompt pointed out a compositional element in whatever the painting was that you're standing in front of and asked you to go look for it. The judgment prompt, again, asked you to relate yourself to what you were looking at.
So, again we're measuring engagement using these three different metrics of gaze tracking, galvanic skin response, and exit surveys. I just want to take a moment to give you a bit of background about the biometric measurement that we're using which is the galvanic skin response. The galvanic skin response is one way to measure that level of emotional intensity or arousal that we talked about before. What it actually measures is how much current is conducted by your skin which is influenced by the production of the sweat by your eccrine sweat glands which you have a high density of in your palmar surfaces. The main function of these eccrine sweat glands is to thermal regulate, but it's been shown that specifically the glands in your hands or on your palmar surfaces are more reactive to psychological stimuli than they are the thermal stimuli.
This is just ... I wonder if the pointer works. Yeah. So this is a schematic of an eccrine sweat gland with it's duct going up through his skin. So basically this gland is innervated by sympathetic nervous system, which we'll talk more about in a second, and under certain conditions will produce more sweat which travel up the duct and allow for electrical conductance across the skin.
There are three neural pathways that are thought to contribute to this response. One that originates in the cortex and basal ganglia, one that originates in the hypothalamus limbic system and a third that originates in the brain stem reticular formation. And that's pretty much what I'm going to say about that. These three pathways have both excitatory and inhibitory influences on sweat production by the eccrine glands.
But as I mentioned, sweat production by these glands is regulated by the sympathetic nervous system and so I just wanted to remind everyone what the function of that system is relative to the parasympathetic nervous system. So your sympathetic nervous system [inaudible 00:36:02] your fight or flight response. Your parasympathetic nervous system, when activated, induces a calmer breed and feed or rest and digest mode. So parasympathetic activation might result in decreased heart rate, constricted airways and increased stomach activity while sympathetic activation will induce increased heart rate, so you're getting more oxygenated blood to your muscles, relaxed airways so you're taking more oxygen in in the first place and decreased stomach activity so you're not wasting energy on a process that's not imminently relative to your survival.
It's this sympathetic pathway that we're talking about. The idea here is that emotional arousal will stimulate sympathetic activation which will in turn stimulate sweat production which will be manifest as an increase in your galvanic skin response. So the units for galvanic skin response are microsiemens for conductance, right? That's what's plotted here. This is not real data. I'm just showing you what we expected to find in this study. What we expected was that our GSR response or how long people spend, we thought both metrics would be a function of prompt type, would vary across the four prompt groups. We expected the participants receiving a free viewing prompt would have about the same level of response as not receiving any prompt and that receiving a search prompt or, in particular, a judgment prompt would elevate your GSR or cause you to spend longer at a designated work of art.
I just want to take another moment to tell you how we analyzed our GSR data. Galvanic skin response data. Because there are multiple ways of doing this. Because the absolute number of microsiemens or the GSR reading is going to vary from person to person, you have to normalize these values. So a common way of doing that is to normalize it to the mean for the entire experience. One of the things that I'll be showing you is the average GSRZ score at a particular object which looks at the GSR values that were listed by that object in the context of the mean GSR score over the course of the entire exhibition, right? So you're normalizing one experience to the entire experience.
Another way that we'll be quantifying GSR data is to look at the magnitude of their response. So the biggest change. So, to subtract the minimum value of GSR in a particular object from the maximum value to get the delta GSR. Alternatively, you can just count the number of peaks that appear in the GSR trace. It turns out that this metric is highly correlated with how long you spend at an object, with your dwell time, so that's one caveat. But these are the three quantifications of GSR that I'll be showing you.
All right. So let me introduce you to our sample population which I will say was very small. By the time we got everything working and everything in order and ruled out using one prompt delivery system, the exhibition was almost closed. So we just ran as many people as we could and that turned out to be 14 participants which were divided across these four groups. Again, there was the no prompt group and three prompt groups that received the three prompts in different orders over the course of those nine paintings.
All of our volunteer participants were female. All but one self identified as white. And all but one had been to PEM before. So, not the most diverse group of people you've ever seen. But they did span a number of age ranges. We had them check a box. Are you 25-34? Are you 35-44? All the way up to 74 and we had a pretty good representation in each of those age ranges. This is just data corroborating what comes out of our marketing department showing that younger people tend not to be members of PEM while older people tend to be members of PEM. A little fact.
So there are four questions that I want to address in the context of this study. One directly addresses our hypothesis and asks what affect do viewing prompts have on dwell time and emotional reactivity as measured by GSR? The second question looks at how long visitors spend in each of the three galleries of the exhibition and what their galvanic skin response does over the course of the exhibition and I'll give you a bit more background as to why we were interested in that a little bit later. We also look at how those metrics are impacted by prompts. The third question I'd like to address has to do with looking behavior versus reading behavior and whether those two sets of actions are impacted by the different kinds of viewing prompts. And then finally, as I alluded to earlier, we'll look at what the effect of media experiences are on these different metrics.
So we'll start at the beginning and look at what effects the viewing prompts had on dwell time and on GSR responses across these nine works of art.
Here I'm showing you mean dwell time in minutes spent on each of those nine objects by the 14 participants as a function of viewing prompt. So we have our no prompt group, our free prompt group, our search prompt group in which there's an outlier that I need to go track down, and our judgment group.
So, although ... oh, right. Sorry. I wanted to just make the statement that I'm going to report trends as well as statistically significant results. Just because our sample size was so small, we're trying to glean as much as we can from this data.
So, this is not statistically significant, but you can see that there's a trend for the search prompt and at least the judgment prompted group to be spending considerably longer at each work of art relative to the no prompt group and the free viewing group. So these two groups spent maybe like three quarters of a minute at each object on average whereas the judgment prompt group was spending closer to a minute and a half.
So we know that the judgment prompt group seems to be lingering a little bit longer at each of these objects, but are they having a more emotionally resonant experience? To gain insight into that we can look at our three quantifications of the GSR response. So this is showing you the mean GSRZ score as a function of prompt group and it's not the most compelling data, but what it does show is that while the no prompt group, the free viewing group and the search group had responses that really hovered around the average for the exhibition which is represented by this red line and is a value of zero. The judgment group had responses that were above average. Not a very robust response. You can see they're only .2 standard deviations above the mean, but still a difference.
We can also look at the delta GSR. So that difference between the minimum value and the maximum value of GSR that was elicited by each painting. What we see here is that each of the three prompt groups demonstrate significantly larger delta GSR as relative to the no prompt group. And if we look at the number of peaks, we see again that the judgment prompt group this time significantly, barely, has significantly more of those phasic peaks in the GSR response relative to the no prompt group.
Just to summarize what we've seen so far. It looks like viewing goals, in general, were associated with participants spending longer, they have longer dwell time and reacting more strongly as measured by GSR to a given work of art. And there was a trend for the judgment viewing goal to have the strongest impact on engagement. In a few minutes I'll come back and talk about some of the implications of those findings, but I first want to tell you a little bit more.
Oh, right. I forgot about this. We just looked at this. So in our exit survey, we had participants rate their reactions to each of the nine paintings on those two dimensions of emotion: arousal and valence. We didn't call it that. We called it intensity and pleasure or something. Something that they could understand. But we had them rate their responses to each of those nine art works on those two scales and that's what's plotted here, broken down by prompt group. So there were really no differences in the valence across the four prompt groups, but what was interesting is that the no prompt group perceived themselves to be more aroused than any of the prompted groups. It's interesting, right? Because this is the opposite of what the GSR data showed us.
So, one theory or hypothesis is that there was something about the delivery of the prompts, which were just paper packets. Each page had a picture of a painting and some text. So it wasn't the most exciting thing to have and it may have been a little burdensome to flip through and find the right page. We think the delivery of the prompts may have dampened the perception of how intense the experience of viewing the art was. But you can see that on the physiological level that was not the case. So we're still kind of reconciling all these pieces of data, but it's sort of an interesting dichotomy.
Okay. So how long are visitors spending in each gallery at the exhibition and is that impacted by prompts? There have been many studies in the museum field, including one using the EEG, showing that dwell time as well as intention tends to wane over the course of an exhibition. So we wanted to see in our data set whether that was happening and, if so, at what point people sort of started to drop off. Here again, we plotted the mean dwell time in minutes per gallery in each of the three galleries. So what you can see is that people spent the least amount of time in the third gallery of the exhibition. It turns out that when you break those bars into who was prompted and who was unprompted, this isn't significant, but there was a trend for the prompted participants, whose time is shown in blue, to always be spending longer than the unprompted participants shown in the red.
This difference between the dwell time in each gallery was bolstered, also, when we ... or was supported by looking at the sweet rate index which is basically a metric that normalizes dwell time to the amount of area that there is to cover. So it's dealing in units of feet per minute. So, how fast are you moving through the exhibition? On this graph, bars that sit up here indicate that people are moving faster whereas those sitting down here indicate the people are moving slower. So what you can see is that in the first two galleries people are moving at about 60 feet a minute and that nearly doubles in the last gallery.
Interestingly, if you break these down again by who was prompted and who wasn't, you can see that the unprompted participants in red are always moving faster than the prompted participants in blue.
Okay, so that's how long people are spending in each of the galleries and that sort of corroborates other findings in the field, but how are they experiencing this on an emotional level? I will confess that I'm still struggling to understand the Z score data, but what it shows us is that, again, it's not a robust affect. We're only looking at .2 standard deviations above and below the mean, but what we can see is that people tended to be ... or the participants tended to have a below average GSRZ score the first gallery and above average GSRZ score in the second gallery and about an average GSR score in the third gallery. If we look at the mean delta GSR, we can see a trend toward a decline in the delta GSR in the last gallery. Also, if we look at the mean number of GSR peaks demonstrated in each of the galleries, we can see that it's relatively low in the last gallery compared to the second gallery. It's also relatively low in the first gallery which is something that we're still working to understand.
We've seen that participants spend the least amount of time and move the fastest in the last gallery of the exhibition and that prompted participants have a tendency to spend a bit longer than unprompted participants. I meant to mention that prompted participants are spending, on average, about five minutes longer per gallery which by my calculations is too long to account for that time being spent just reading the prompts. So, there must be something else going on for them.
All right. And then looking across the GSR metrics, we can see that participants are least emotionally aroused in the last gallery and seem to be the most emotionally aroused in the second gallery. So I'll comment here that I haven't done this analysis formally yet, but the second gallery just anecdotally had a higher density of objects. So it could be that there was just more to see and more to experience in that gallery which could account for some of these differences.
So what are the implications of these findings? It looks like giving visitors a viewing prompt may, in fact, help them to engage in various ways with the works of art that are presented in the galleries. And here I'm just showing you a blob of one of the labels in this exhibition that was associated with this work of art and it's just to make the point that, in fact, we're already in the practice of using search prompts. Of the nine labels associated with the nine paintings that we studied in this gallery, six of them had search prompts, by my assessment, in them. We use these approaches without really knowing the impact. So hopefully, these data can help us to use these strategies in a bit more informed way.
Specifically, it seems like using judgment prompts at key points in the exhibition might be a way to help people to linger a little longer and maybe connect with the works of art a little bit more strongly.
Okay. So a hotly contested topic in our museum is whether people actually read labels. So one of the things I wanted to look at was how many of our 14 participants spent any amount of time reading the label associated with these nine works of art. And so that's plotted here. On the Y axis is the number of participants out of 14 performing either looking actions or reading actions. So, looking at the painting or reading the associated label at each of the nine works of art that we selected. What you can see is that across the board with a couple exceptions, most people are reading the labels. I haven't talked to my boss about this yet because he asserts the opposite.
What's interesting is that if you look at these bars that reflect the people who aren't reading the labels, these three objects had tombstone labels by which I mean they had the name of the artist, the year the work was produced and the media that was used, but it offered no commentary on the work itself. So there really wasn't much to read, in short. It looks like ... if we assume that people read at a rate of about 200 words a minute, it looks like at each of our nine objects people are spending the appropriate amount of time reading. So, they're reading to completion basically. All right. So they're reading to completion which again is kind of against or contrary to the popular thought at our museum.
Okay. So I want to just zoom out a little bit and compare some of our metrics between looking and reading behaviors. We can look at how much time, on average, people spend looking at the work of art versus reading a label and we can see that people spend many times longer looking than they do reading. If we break these data down by whether the participants were prompted or not, again this is not yet significant, but there's a trend for prompted participants to spend longer looking than unprompted participants with no difference in the time spend reading. That may be because they're reading everything that there is to read so they can't spend any more time reading. That's my hypothesis.
We can also look at what our GSR data shows us when people are looking versus reading and by all three metrics, whether it's mean GSRZ score, the mean delta GSR or the mean number of peaks elicited by each object, we can see that people are more emotionally aroused when they are looking than when they are reading. Again, if we break these down by whether participants were prompted or not, across the three metrics we can see that there's a trend at least toward an increase arousal when looking after being prompted relative to being unprompted. And in a couple of these metrics the Z score as well as the delta GSR, you can see that there's a trend toward prompted participants being more emotionally aroused while reading the label relative to unprompted participants.
All right. So what I'm taking away from these data is that participants do read labels and that could be because they know they're being observed so they might be a little bit more diligent about attending to everything in the exhibition. However, I would sort of expect that that self awareness would decline over the course of the exhibition and so that you might see ... if that were true you might see a decline in the number of participants reading labels or how long they spend reading labels, which we don't see.
They also report that they start off being self conscious and then it kind of dissipates over time and also if you look at the GSR trace, the first few minutes tend to be really high and then as they settle into the exhibition it comes down. And then we saw that prompted participants spend longer looking relative to unprompted participants and seem to be more emotionally aroused with looking and potentially also when reading after being prompted with one of these three types of prompts.
So this is the last data set that I'll show you and it addresses what impact integrated media experiences have on dwell time as well as emotional arousal in this exhibition. As I showed you on the floor plan, there were several points that had media experiences. We analyzed three of them which I depicted here. Sorry. I couldn't quite get these to line up, but this is the image of the cube which is plotted here. As I mentioned it had a voice over track which lasted about a minute and 25 seconds.
When you exited this cube experience, the first thing you confronted was this trio of objects that was accompanied by a Bob Dylan song playing in the background. So that is represented here by this music one label.
And then at the end of the exhibition there was this huge mural. We had commissioned a Native American song writer to write a song inspired by the mural kind of in T.C. Cannon's style. So across from this mural was situated a TV screen on which was shown a music video featuring this song and the artist who wrote it. That media experience lasted three minutes and 43 seconds.
So, what I'm plotting here is the mean dwell time per object for each of the nine objects that we were looking at previously as well as for each of the three media experiences. If you look carefully, what you can see is that people are basically spending the duration of the media experience at the media experience. So it's not like they're leaving early. So basically when the experience is a minute and a half, that's how long people spend. When the experience is almost four minutes, that's how long people spend.
To some extent we might see integrated media experiences in the gallery as one way to get people to linger if we have cause to do that. We can also look at the GSR readings that are elicited by these three experiences. So I'm joining the three metrics here again. To be perfectly honest, I'm still trying to understand why these three media experiences had below average arousal. You'd think it would be the opposite as is reflected in these other two metrics. So the mean delta GSR, we see that the musical experience and the mural experience elicited higher levels of arousal than the nine objects. So too with the mean number of peaks.
But what we can see is that it's not true that all media experiences are more arousing because this cube experience seems to be less arousing than either the music experience or the mural experience.
So this is just a first glimpse at what impact these media might be having, but it's kind of interesting to think about.
Okay, so I'll end there and I'll just, again, remind you of our equation for engagement and make the point that we can use the neuroscience literature to better understand each of these elements of engagement and we can use this mixed methods approach, which I hope will only grow in the coming years in terms of techniques, to understand visitor engagement in the context of the gallery.
So with that, I'd like to acknowledge all the participants that kindly volunteered to make this study possible and I'd also like to thank my colleagues at PEM, especially our director, Dan Monroe, who had the idea to instigate the neuroscience initiative in the first place. Also thank our neuroscience advisory committee and Jeff Gillert [inaudible 00:56:52] who was our collaborator for this study.
So with that I'll be happy to take any questions.