Alumni Outcomes
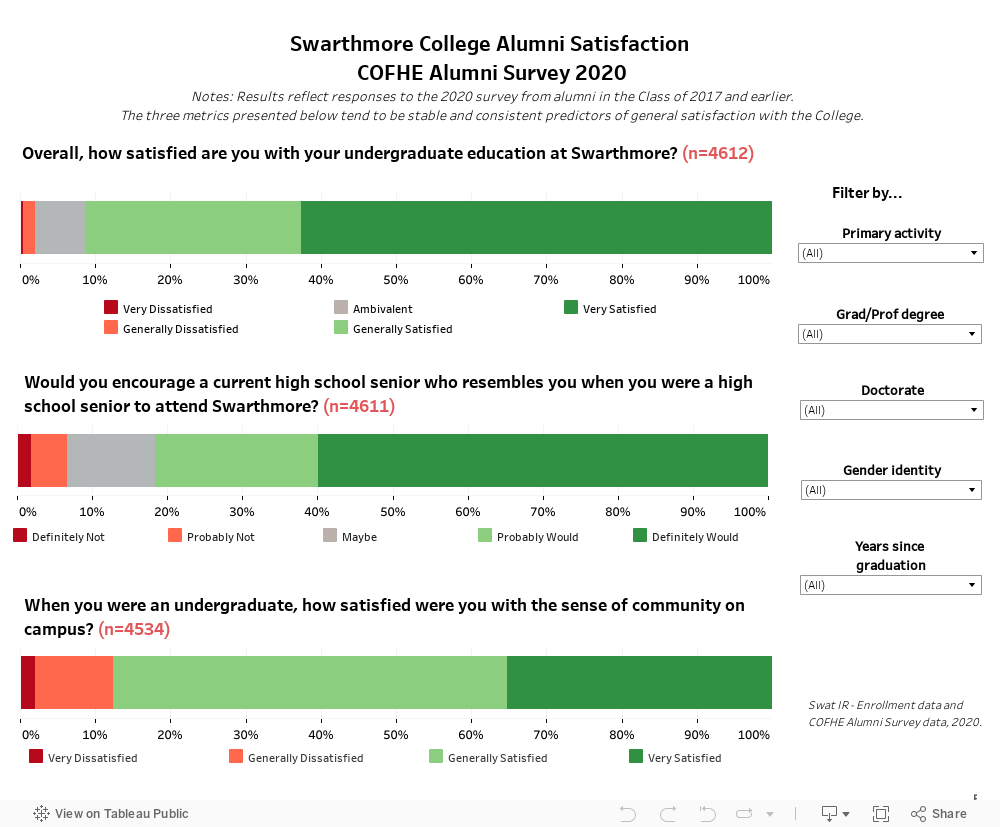
Though the College collects information about our alumni from a range of sources for our Alumni Records database, we also routinely ask about current activities on our COFHE Alumni Survey (managed by the IR office). The most recent survey was conducted in 2020. We have included an interactive visualization on alumni satisfaction [click here]. We also prepared a summary of the employment and education outcomes. The summary is available here; below is an overview.
Alumni Survey 2020: Outcomes
Employment and Pursuit of Advanced Degrees
Overview

- In fall 2020, amidst the COVID-19 pandemic, the College surveyed all Swarthmore alumni, asking them to reflect on many aspects of their college experience, and how it may have impacted current activities. The response rate was 31%. This report focuses on the employment and advanced education outcomes of these alumni based on the survey.
- Over half of Swarthmore alumni who responded (55%, across all years) are working full-time, with an additional 10%working part-time. The unemployment rate (not employed with seeking employment as their primary activity) for alumni respondents is 1.2%, below the national average (for individuals with a Bachelor’s degree or higher) of 4.2% at the time of the survey [1] [2]. The unemployment rate for recent graduates at Swarthmore is around 5%, compared to over 7% nationally, according to the Bureau of Labor Statistics.
- Consistent with our liberal arts mission, over a third of graduates (39%) are working in fields unrelated to their undergraduate majors. Thirty-seven percent work in fields related to their major, and nearly one-quarter (24%) are working in the field of their major.
- Most often, those alumni not currently employed are pursuing further education (4% of all respondents).
- The rates at which Swarthmore graduates earn advanced degrees are very high. About sixty percent of those who graduated five years ago (Class of 2015) reported earning or currently pursuing a graduate or professional degree – and the rate was even higher for each of the older classes, to a high of 86% of the Class of 1969. Across all classes (excluding 2019 and 2020), 32% of the graduates had earned or were pursuing doctoral degrees at the time of the survey.
- While the largest share of doctorate earners who were employed full-time work in the field of higher education, 44% do not.
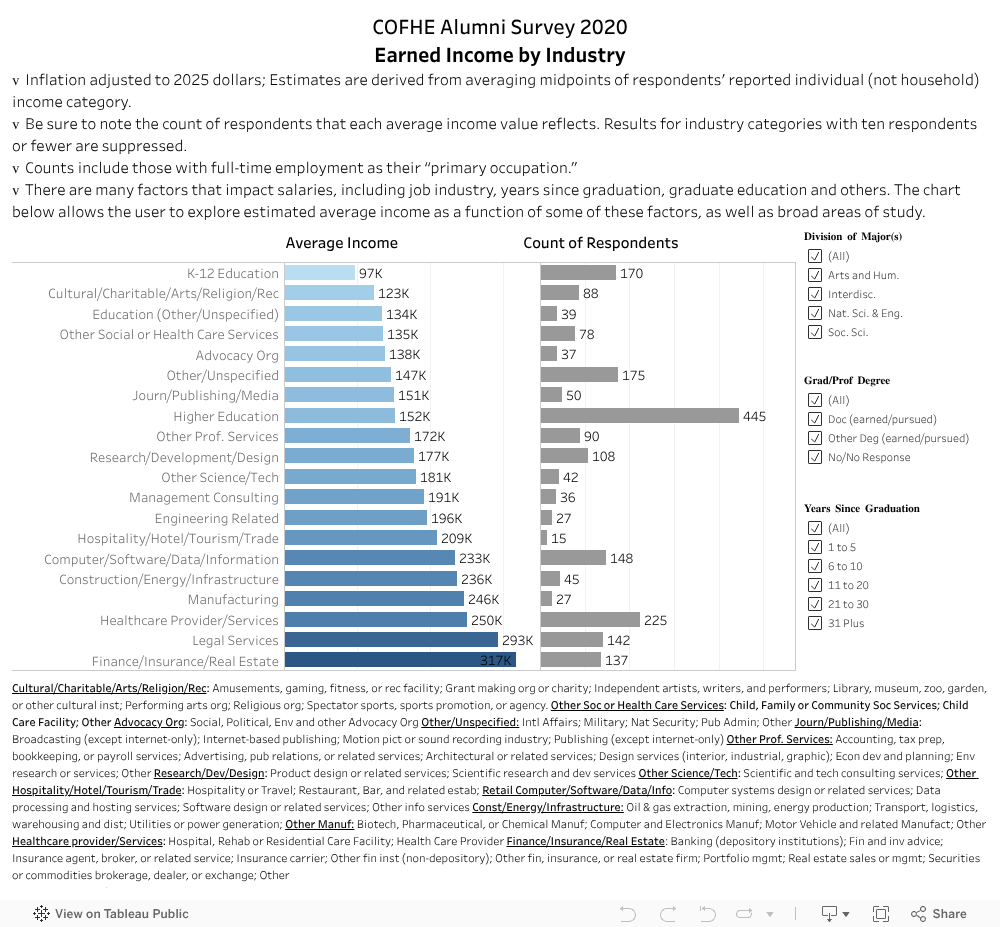
- Graduates work in a range of occupations, with the largest categories being educators, trainers, or librarians (23%), health or mental health professionals (13%), scientists, social scientists, or mathematical occupations (10%), legal professionals (8%), business or management occupations (7%), and computer scientists, programmers, or technologists (6%).
[1] Table A-4. Employment status of the civilian population 25 years and over by educational attainment, (seasonally adjusted). September 2017, Bureau of Labor Statistics.
[2] Those who are not employed are classified by their reported “primary activity.” The “Other” category includes those who are retired, those who are employed but on leave, and those who are not employed but not seeking employment (for reasons other than family care or education).