- College Computer Skills Assessment (Ella Foster-Molina)
The assessment linked online here and for downloads here is designed to briefly assess how efficient you are with computer skills. This includes how you use keyboard shortcuts, the context menu with a mouse, file management, environment setup, and document headers. It does not comprehensively test your efficiency. Instead, it quickly spot-checks it. If any of the tasks within a section are unfamiliar, you are likely missing other related skills as well. If so, practice a more comprehensive set of computer skills in the tutorials.
The assessment is modular. Each section can be completed independently in a few minutes. It should take around 10-20 minutes to complete in full.
- College Computer Skills Tutorials (Ella Foster-Molina)
These tutorials, linked online here and for downloading as a Word document, are designed to help you become a more efficient and effective computer user. They focus on efficiency with your mouse/trackpad, keyboard shortcuts, file structures, organizing a Word document or Google Doc, and your overall computing environment.
Choose your approach
Option 1: Complete each section independently. This is best if you know which skills would benefit you most.
Option 2: Start at the beginning. The sections on “Keyboard Skills” and “Mouse/Trackpad Skills” are short and will provide the quickest gains in efficiency for most users. These sections and “Organization within a Document” can be completed on a tablet or computer.
Option 3: Start at “Environment Setup.” This section demonstrates how to download, save and organize your work in one document. Proceed to “File Management.” These sections provide the biggest gains in efficiency. They also take longer to complete. Note that both sections are designed for PCs and Macs, which have sophisticated file management systems and flexible environments.
Option 4: Complete the Computer Skills Assessment now, later, or in parts. Just like these tutorials, the assessment is modular. Depending on your comfort with the material, you can complete sections of the assessment or all of it. If you are already familiar with the skills and simply want to run a quick self-assessment, skip these tutorials. Head straight to either the online or downloadable assessment.
- Guide for Careers in Quantitative Finance (Amine Boukardagha '24)
Quant refers to many careers in the financial industry. It is usually hard to break into quantitative finance with just a bachelors although not impossible. In this guide, I explain how you could build a solid foundation in core liberal arts subjects to prepare yourself for a career in quantitative finance. It covers the following topics:
coursework including math/stats, computer science, economics;
summer jobs including Research Assistant positions & internships;
how to pursue a full-time post-graduation job during your senior year.
- Interpreting and Visualizing Regression Tables (Ella Foster-Molina)
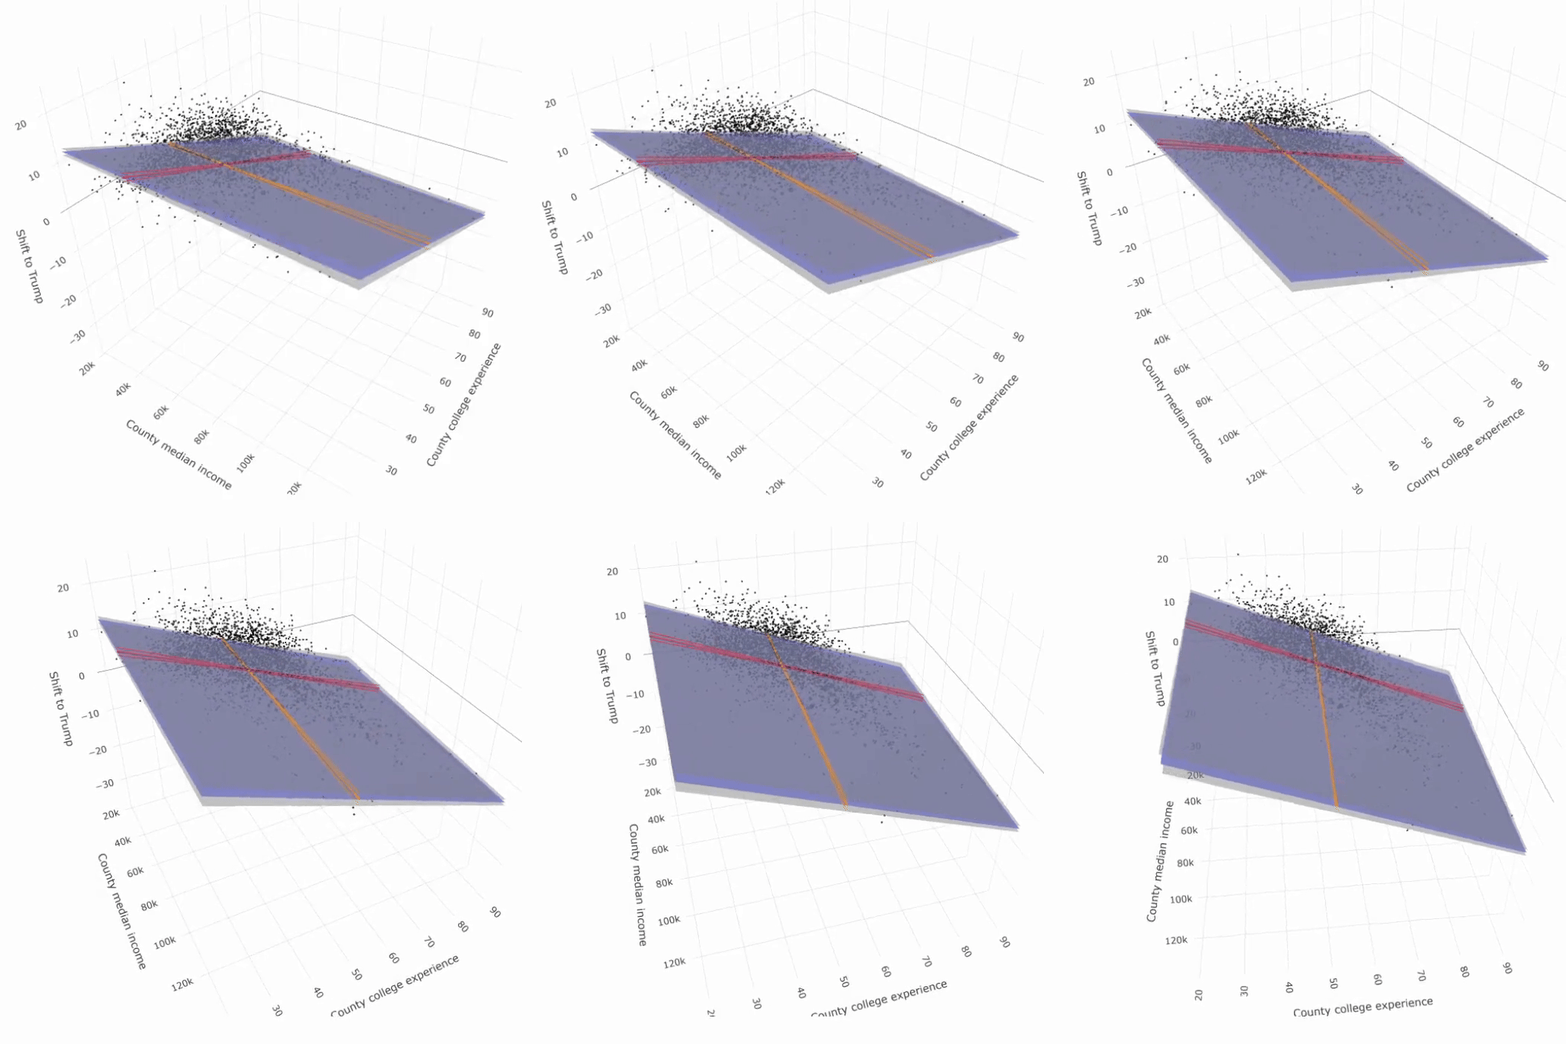
The interactive webbook at https://swat-ssql.github.io/interpret-regression-tables/ provides a basic understanding of regression tables commonly presented in quantitative papers and highlights common heuristics for interpreting those tables.
The second section visualizes marginal effects in an interactive 3 dimensional regression surface. The gif below demonstrates some of the functionality of that interactive 3D visualization.

- Stata Guide for Intermediate Users (Alicia Liu '24)
- paths and directories in Stata,
- the preserve and restore commands to work with a variation on a dataset without losing the original dataset as an alternative to frames,
- frames, and
- where to find help: useful websites, on campus resources, and a note on LLMs.
Resources
We have created some resources that will help you with learning and using quantitative methods in your courses, seminars and independent research. Follow the links in each section below to find more information.


