Robert Manduca '10 Maps Every Job in the U.S.
The Washington Post: Nearly every job in America, mapped in incredible detail
Among all the things that distinguish American cities from one another — their architecture, their demographics, their history and their terrain — their economies vary widely, too. Washington is, of course, a city of government work. Charlotte is a banking hub, Manhattan a financial center, Boston an education mecca. Metropolitan Cleveland remains relatively industrial, while Las Vegas runs on tourism.
These differences form economic identities that shape each city as much as their culture and geography do. And they're starkly — and beautifully — visible in a new visualization, made by Harvard Ph.D. student Robert Manduca '10, that maps nearly every job in America, one dot per job. His project, which draws on Census data reported by employers, is modeled off Dustin Cable's well-known racial dot map that mapped every person in the country.
The result, in metropolitan Washington, looks like this, with manufacturing and trade jobs shown in red; professional services jobs in blue; healthcare, education and government in green; and retail, hospitality and service-sector jobs in yellow:
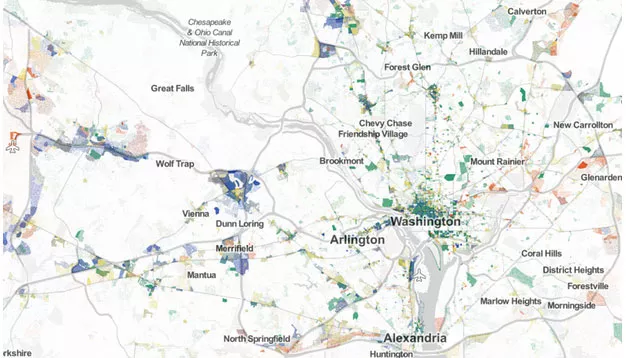
Read the full article and view more map samples at The Washington Post.
Manduca graduated from Swarthmore College in 2010 with honors in economics and minors in political science and statistics. He has a master of city planning from MIT and is currently a Ph.D. student in sociology and social policy at Harvard University.